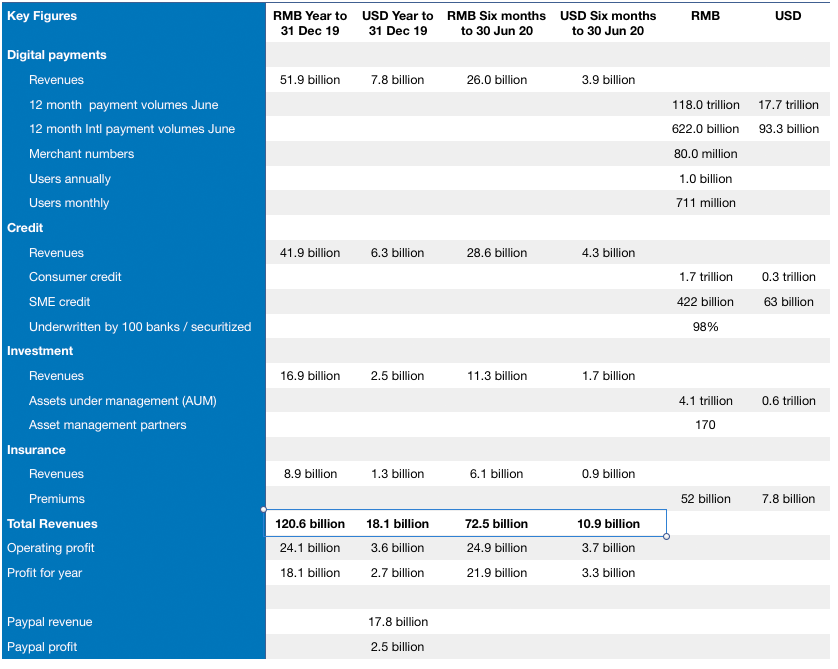
Yesterday Ant Group, formerly Ant Financial, filed its preliminary Hong Kong IPO prospectus. The company is going for a dual listing in Hong Kong and Shanghai. The prospectus paints a picture of a fast growing company with more than a billion annual users for its services, with Alipay as the key brand. Alibaba and Ant founder Jack Ma is not a man to bet against. However, the real question is how much is Ant Group worth? It’s rumored to be hoping for a $200 billion valuation. We scratched just a little below the surface and came away with some questions.
Some of the key figures are extremely impressive. The prospectus shows revenues for the six months to June up 38% to RMB 72.5 billion ($10.9bn) and the profit for the first half of RMB 21.9 billion ($3.29 bn) outstripping the profit for the whole of 2019. However, if the comparison is against the second half of 2019, the revenue growth is a more tepid 6.5% and profit is up 35% still very strong figures.
We boiled down these 2020 improvements to three factors. There was significant growth in lending and non-payment revenues, Ant pulled back on marketing spending, and a curious drop in transaction cost percentage, which is Ant’s largest expense.
Perhaps the most promising sector is investment services, which is showing consistently strong growth with a lot of upside potential.
Growth flattening in some areas, accelerating in others
Ant claims to be the largest Chinese player in all four of its segments. It’s the largest Chinese mobile payment provider, the largest online provider of consumer and SME credit, online investment services, and online insurance services.
Digital payments made up more than half of revenues in 2019, but growth is tailing off, and it now accounts for only 36% in the first half of 2020.
However, the other three segments are growing gangbusters. In the first half, the non-payment segments are up 57% compared to the same period last year, but a more modest 19.4% compared to the second half of 2019.
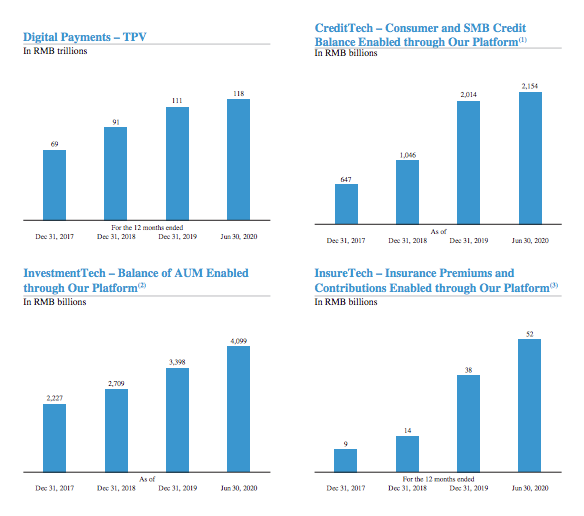
Credit is now Ant’s largest segment accounting for more than 39% of first half revenues. The authorities are rumored to have recently started investigating credit advanced via online platforms over concerns about the potential for an uptick in delinquency. The issue raised was that the actual risk is born by the banks. This latter point is confirmed in the prospectus where Ant says 98% of credit risk is passed onto banks or securitized. However, while Ant’s prospectus shows increased credit stress, it doesn’t appear to be that significant.
The figures for the credit segment were tricky to reconcile. The most recent six months show a 60% revenue spike over the same period last year. But the graph for credit balances shows a flattening. A possible explanation is that the COVID-19 period resulted in significant new advances as well as repayments.
Why are transaction fees so choppy?
A curiosity for which we failed to find an adequate explanation in the prospectus related to choppiness in direct costs, specifically transaction costs, which is the company’s largest expense. This, combined with the reduction in marketing spending this year, is a major contributing factor to the blow out profits in the first half of 2020.
In 2017 direct costs accounted for 36.3% of revenues, increasing to 47.7% in 2018 and 50.2% in 2019. For the first half of this year that percentage fell back to 41.4%. The impact of the lower percentage is more than RMB 6 billion on the bottom line.
This was the explanation given: “Transaction fees increased at a slower pace than revenues, primarily due to lower rates of growth of TPV. In addition, our revenues outgrew transaction fees partially due to stronger growth in revenues from our digital finance technology platform, as users used more digital finance services on our platform, which enabled more funds to be retained in our platform and enhanced our operational efficiency.”
Maybe this is saying there was a revenue shift to credit and investment and away from payments. But that’s been a trend since 2017 and the cost percentage was going up rather than down. It also might be saying that users are adopting additional services, so fewer introduction fees are being paid. But, if so, it would be useful to quantify how that has changed given the material figure.
If transaction costs and marketing for the first half of 2020 were the same percentage as the whole of 2019, the profit would have been just under RMB 13 billion or 18% of revenues compared to the 33% reported. That’s still an impressive figure, but not the growth in profit being shown. Profit for 2019 was 15% of revenues (Paypal 14%). That’s why a more robust explanation for the transaction cost fluctuations is warranted.
A massive 2018 marketing push
When looking at the figures of a public company, it’s nice to see predictable numbers with simple explanations for deviations. On the other hand it’s also great to see the massive growth that Ant has achieved in its short life!
In 2018 the company effectively plunged into a steep loss if you strip out an extraordinary gain of RMB 22.8 billion ($3.4 billion) on a subsidiary’s disposal.
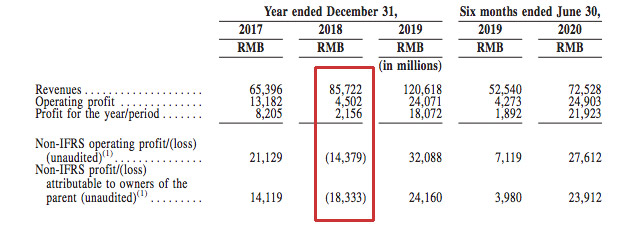
The reason for the loss was a massive marketing push tripling 2018 spending. Promotional and advertising expenses went from RMB 13.9bn (2017) to RMB 45.7bn (2018 $6.87bn) and back to RMB 16.1bn (2019).
The 2018 push resulted in growth in 2018 users by 24% and revenues by 32%. By comparison, 2019 shows a more modest user growth of 6.6% and revenues rose more than 40%.

The net effect is that profit increased by RMB 10 billion between 2017 and 2019, but the additional 2018 marketing cost three times that gain at almost RMB 32 billion. Of course, the revenues hopefully will be recurring, meaning there should be a long term payback from the marketing.
Despite a few caveats, the key takeaway is the healthy growth in lending and investment services, which look like they have plenty of headroom.
